Brainstorm
Before I started actually working on the project, I brainstormed topics that I would focus on throughout project one. I eventually came up with Internet Addiction because the internet has become a part of our daily lives and there are people who use the internet excessively. I narrowed my focus from internet addiction to internet addiction in Korea because it is more prominent there based on the fact that they are one of the most wired places in the world. I decided to create an infographic with some illustrations included. I drew sketches to get an idea on what the product should look like.
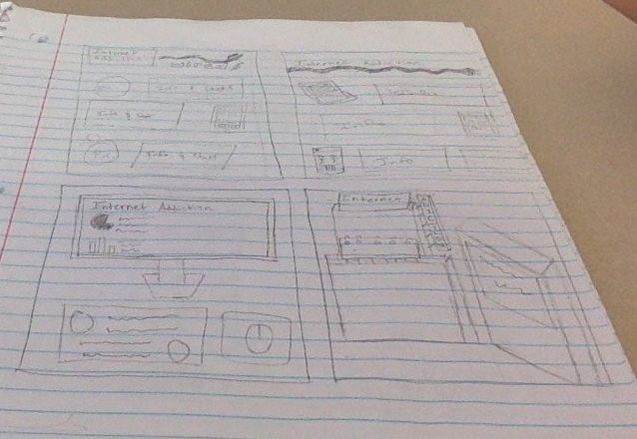
I chose the sketch on the bottom right and decided to build upon it.
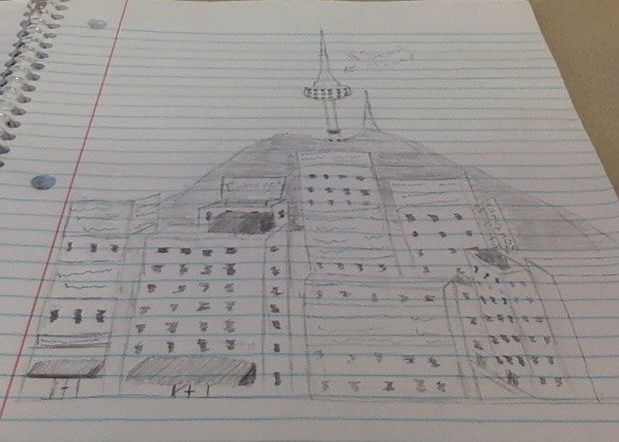
This is a city in South Korea with the N Seoul Tower in the back
|
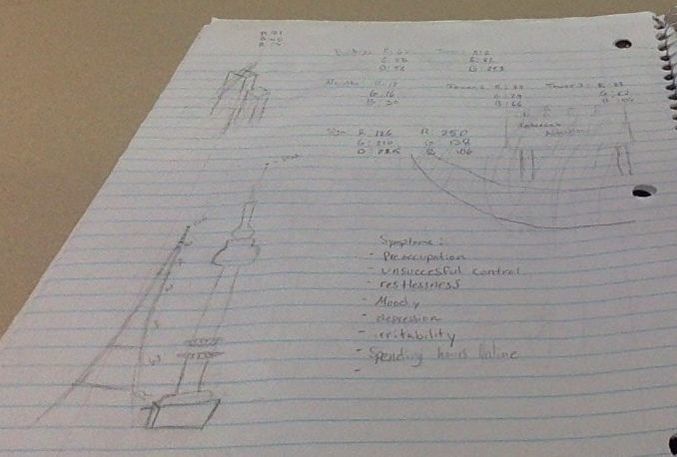
I drew the N Seoul Tower
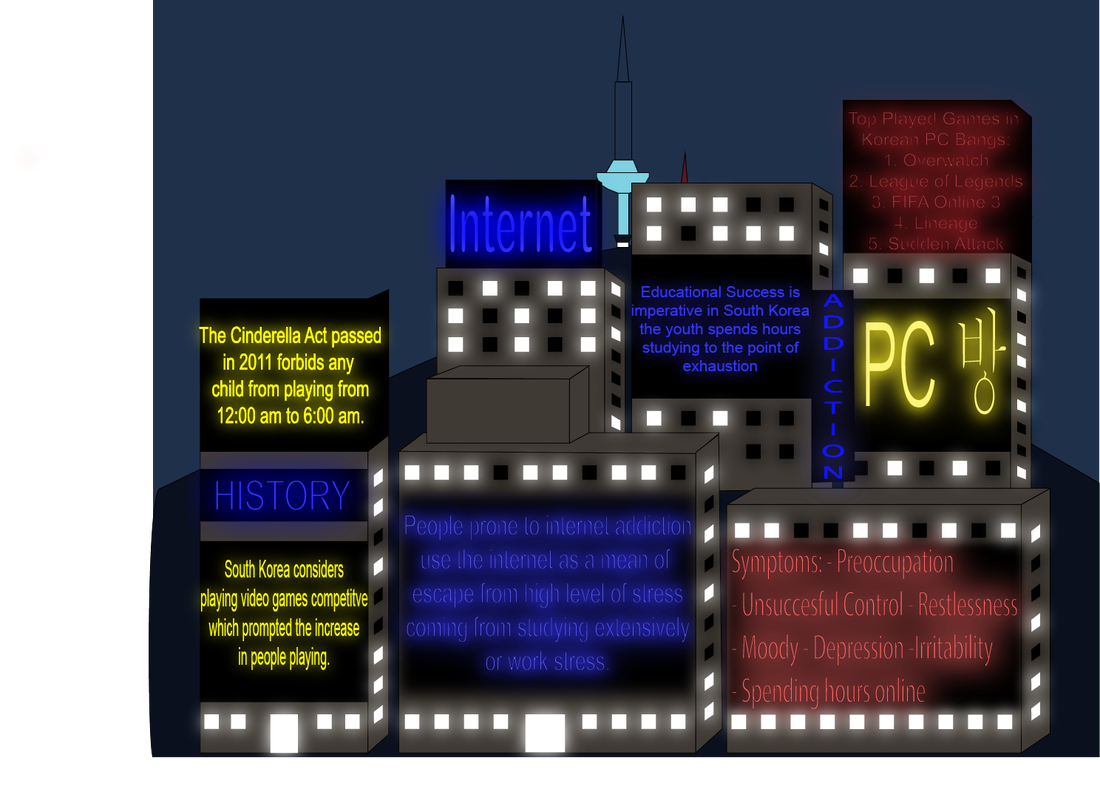
Through out the sketching process I wanted to make a city with a tower and make it look similar to the N Seoul Tower to represent South Korea. The signs would have information about the internet addiction in South Korea. The plan was to make the infographic in Adobe Illustrator and have the signs glow to make the information stand out more to the reader.
|
The Experience
|
I honestly thought gathering information and making infographics was going to be easy . But I learned what I made wasn't a proper infographic because of the missing sources and the disorganized information. I was too focused on the idea that I sketched for the infographic and disregarded the important factors that make up a proper infographic. I later compared my infographic to examples online to find out what I was missing from my infographic and how it could improve. The program that I used to make the infographic was Adobe Illustrator. I just recently received the program during the early stage of the project and was eager to use it. This slowed down the making of the infographic because I had to experiment with the tools and figure out how to use the program. Even though the product didn't turn out too good, it was definitely a learning experience. I realized proper planning and using time more efficiently would vastly improve the quality of my works.
|
